
Self-hosted in your K8s
The agent runs inside your Kubernetes cluster and queries tools locally — no public endpoints required.
SREBot runs as a local agent in your Kubernetes cluster, queries Prometheus and logs, and returns an evidence-backed RCA directly in Telegram, Slack, Discord, or Time.
Agent runs inside your cluster
Prometheus and logs queried locally
RCA delivered in team chat
What changes for on-call
The product is designed around the actual debugging loop: alerts, metrics, logs, hypotheses, follow-up questions, and a saved incident history.
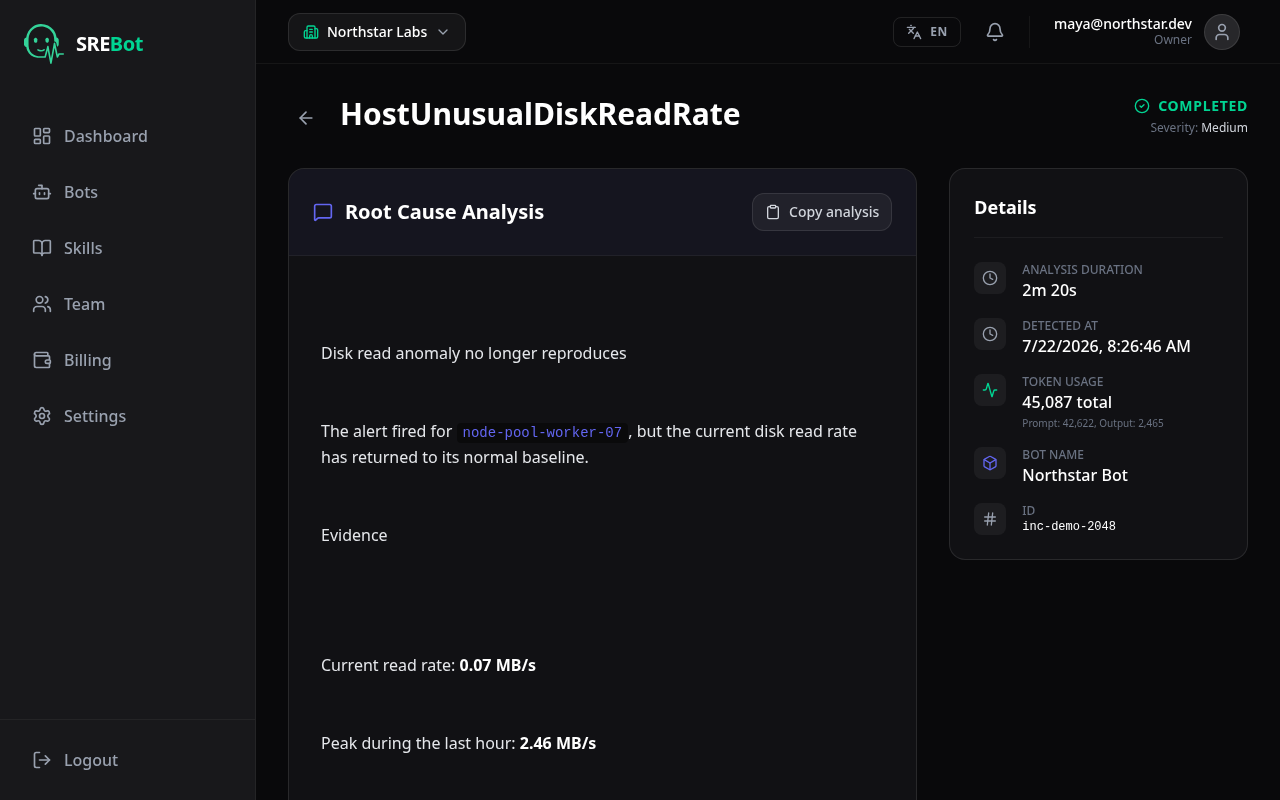
The report explains the likely cause, shows evidence, and proposes the next verification or mitigation step.
Incident response diff
SREBot is not another dashboard. It automates the repetitive evidence-gathering loop that normally happens while the incident thread is already moving.
The agent runs the first PromQL and log checks automatically instead of making engineers start from a blank page.
Each RCA keeps the alert, tool calls, findings, and follow-up discussion in one place.
Engineers can ask another question in chat while the bot keeps the investigation context.
Alertmanager posts to Telegram, Slack, Discord, or Time. SREBot parses labels, severity, service, namespace, and alert text.
The in-cluster agent runs read-only PromQL and log searches against your observability stack without opening inbound access.
The report explains the likely cause, shows evidence, and proposes the next verification or mitigation step.
Reply in chat to test another hypothesis while the bot keeps the incident context window.
SREBot is designed so infrastructure data never leaves your perimeter. The agent deploys inside your cluster and communicates with the Control Plane via an outbound connection only.
The agent runs inside your Kubernetes cluster and queries tools locally — no public endpoints required.
The AI agent operates in read-only mode. It cannot modify infrastructure, restart pods, or alter data.
Bearer tokens, API keys, and passwords are automatically detected and redacted before being sent to the LLM.
Outbound Only
WebSocket over TLS
Pay only for the analyses and follow-up questions your team actually runs.
Perfect for teams of any size
Actual cost depends on alert size, tool output, follow-up questions, and the selected LLM response length.
Everything you need to know about SREBot
SREBot deploys inside your Kubernetes cluster as a Helm chart. When Alertmanager sends an alert to your team chat (Telegram, Slack, Discord, or Time), SREBot automatically parses the alert, deduplicates it, and runs PromQL queries against Prometheus and log searches in Elasticsearch via MCP servers. The AI agent then produces a detailed Root Cause Analysis report with recommended fixes, delivered directly in the chat as a reply to the original alert.
No. The SREBot agent runs entirely inside your Kubernetes cluster and queries Prometheus and Elasticsearch locally over the pod network. No Ingress resources are required. Only LLM prompts and analysis responses travel over an outbound WebSocket TLS connection to the Control Plane. Additionally, Bearer tokens, API keys, and passwords are automatically detected and redacted before any data leaves your network. The agent is open source, so you can audit every line of code.
SREBot integrates with Telegram, Slack, Discord, and Time. Each bot instance supports one platform, and you can deploy multiple bots with different tokens for different channels. The bot supports interactive follow-up questions via reply, mute/unmute commands, and alert deduplication across all platforms.
SREBot uses a pay-as-you-go token-based pricing model at $2.00 per 1 million input tokens. Output tokens cost 5 credits each. You only pay for what you use — there are no monthly subscriptions or hidden fees. Each incident analysis is billed based on the actual prompt and completion tokens consumed. Your balance can be topped up via the dashboard.
Yes. You can reply directly to the analysis message or address the bot by name in the chat. SREBot supports free-form dialogue and retains context for up to 12 hours, allowing you to debug the incident further by executing PromQL queries or searching logs.
Alert → evidence → action
Give your on-call team a local agent that gathers evidence before the incident thread loses momentum.
Get Started Now